
Intellectual property infographics (IPIGs) highlight new evidence-based findings that shed light on how IP affects innovation and welfare in the U.S. and abroad. The latest infographic featuring the USPTO report on the diffusion of artificial intelligence is directly below and our previous IP infographics can be found at the bottom of the page.
Intellectual property and the U.S. economy: Third edition
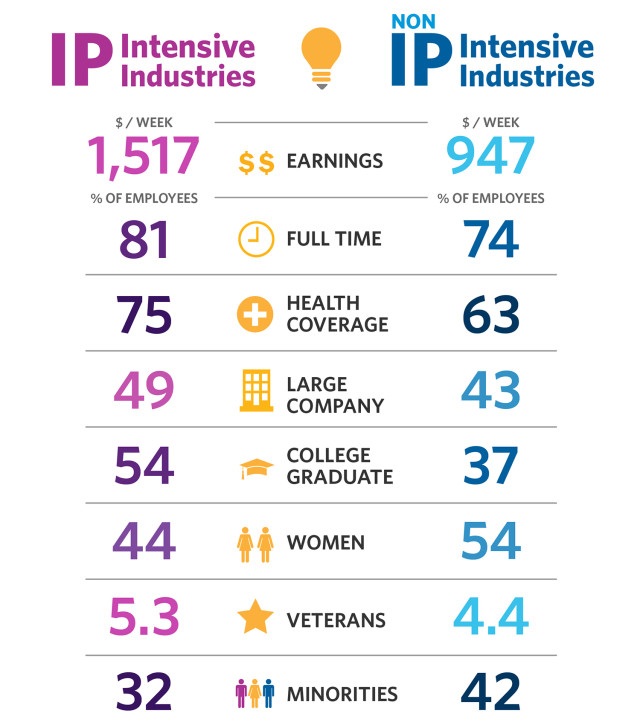
This report on intellectual property (IP) and the U.S. economy builds on reports published in 2012 and 2016. It provides an update on the importance of IP-intensive industries to the U.S. economy and takes a fresh look at the approach used to determine those results.
The update measures the intensity of IP use and its persistent relationship to economic indicators such as employment, wages, and output. It also includes new demographic information about the employees working in IP-intensive industries. The updated data are more refined, thus improving precision in identifying companies within industries and adding new industries to the report.
Read the report or learn more about the image below at the IP and the U.S. economy webpage.
Previous IP infographics
USPTO reports
Discovering value: Women’s participation in university and commercial AI invention
OCE published an article, "Discovering value: Women’s participation in university and commercial AI invention," in the journal Nature Biotechnology.
Using the AI patent dataset and information on the gender of inventors in PatentsView, the article finds that women’s participation in patenting—both in AI and other technologies—is growing and associated with more diverse teams and patents with higher economic value.
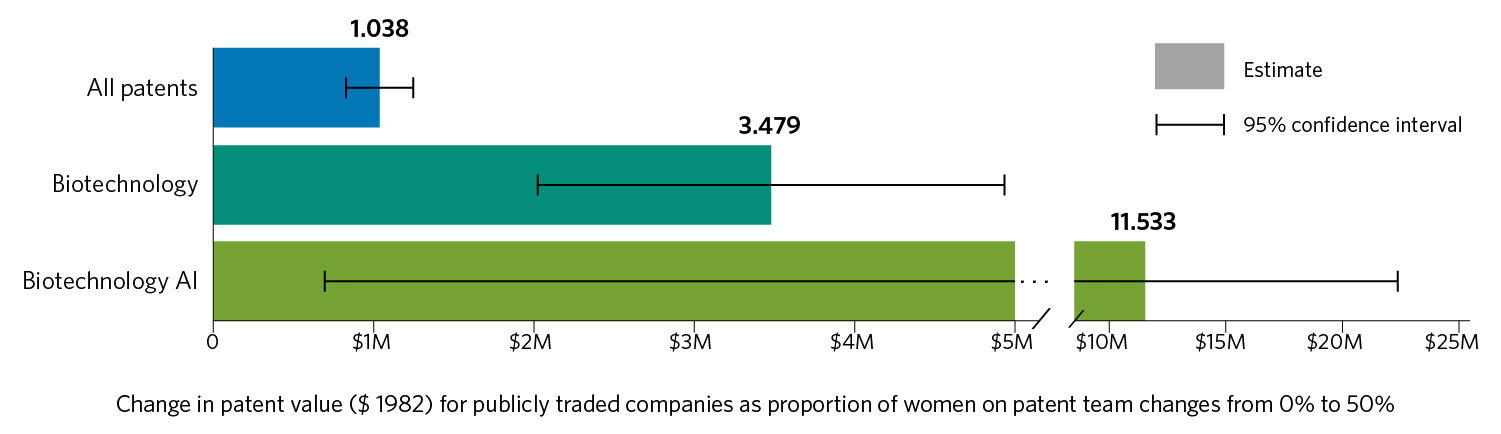
The figure below shows the difference in patent value for inventor teams containing an equal number of men and women relative to those with all men. Using patent values in 1982 dollars from Kogan et al. (2017), across all technologies, patents from gender balanced teams were $1.04M more valuable ($3.28M in 2023 dollars, adjusted using a consumer price index). The difference was substantially larger in biotechnology, at $3.48M ($10.99M in 2023 dollars), and even higher in biotechnology AI, at $11.53M ($36.42M in 2023 dollars).
The figure includes all patents issued in 1976-2020. For more information, read the article.
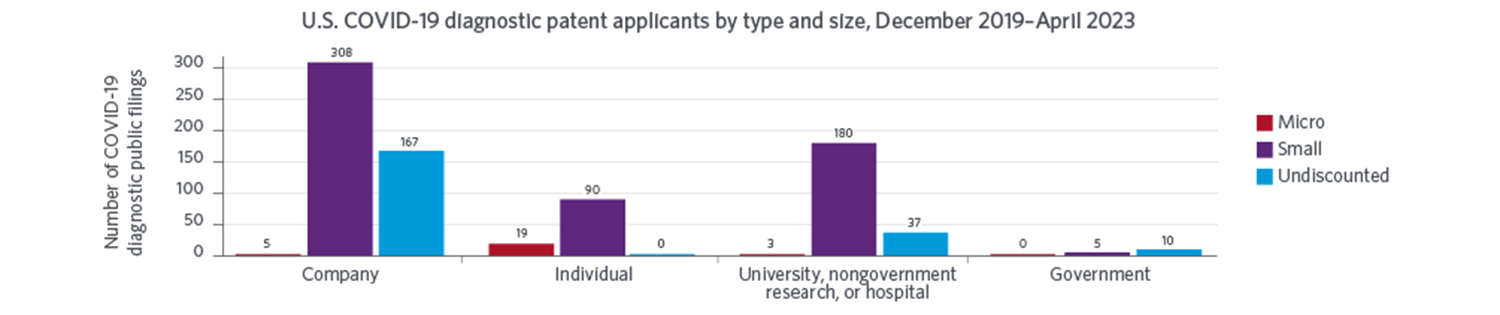
Diagnosing COVID-19: A perspective from U.S. patenting activity
Intellectual property and the U.S. economy: Third edition
This report on intellectual property (IP) and the U.S. economy builds on reports published in 2012 and 2016. It provides an update on the importance of IP-intensive industries to the U.S. economy and takes a fresh look at the approach used to determine those results.
The update measures the intensity of IP use and its persistent relationship to economic indicators such as employment, wages, and output. It also includes new demographic information about the employees working in IP-intensive industries. The updated data are more refined, thus improving precision in identifying companies within industries and adding new industries to the report.
Read the report or learn more about the image below at the IP and the U.S. economy webpage.
Inventors Who Patent Enjoy Higher Lifetime Earnings
The USPTO prepared a report in response to the Study of Underrepresented Classes Chasing Engineering and Science Success (SUCCESS) Act of 2018 (P.L. 115-273). The law required the director of the USPTO, in consultation with the Small Business Administration, to identify publicly available data on the number of patents annually applied for and obtained by women, minorities, and veterans and the benefits of increasing the number of patents applied for and obtained by these groups and the small businesses they own. It also required the USPTO to provide legislative recommendations on how to encourage and increase the participation by these groups as inventor-patentees and entrepreneurs.
A review of literature and data sources conducted by the USPTO found that there is a limited amount of publicly available information regarding the participation rates of women, minorities, and veterans in the patent system. The bulk of the existing literature focuses on women, with a very small number of studies focused on minorities, and only some qualitative historical information on U.S. veteran inventor-patentees. It also found that inventors who apply for and receive a patent may experience a wide range of personal benefits, including heightened prestige, increased income, promotions, new job opportunities, and increased professional networks.
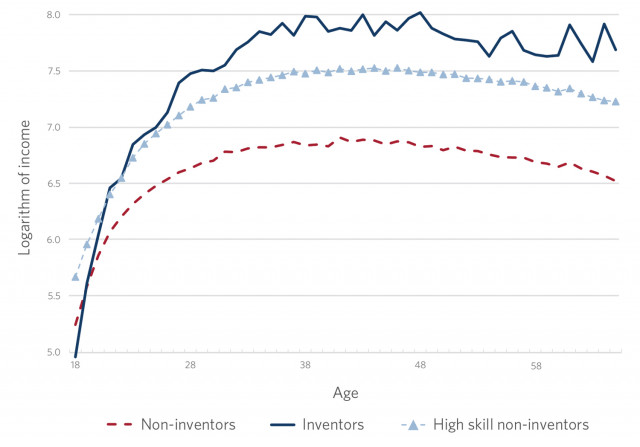
Akcigit et al. (2017) match inventor-patentees to historical Census data to study the relationship between age, patenting, and income. They find that inventor-patentees have higher incomes. Importantly, the relationship persists even after removing the influence of occupation, migrant status, and a variety of other characteristics. The figure above plots the lifetime earning profiles for inventor-patentees, high-skill non-inventors, and other non-inventors. Starting after age 25, wages for inventor-patentees (the dark blue line) are always greater than wages for non-inventors and high skilled non-inventors, with a smaller wage gap for high skilled non-inventors.
Additional information documented by the USPTO on the participation of women, minorities and veterans as inventor-patentees is available in the SUCCESS Act Study.
Economic Notes
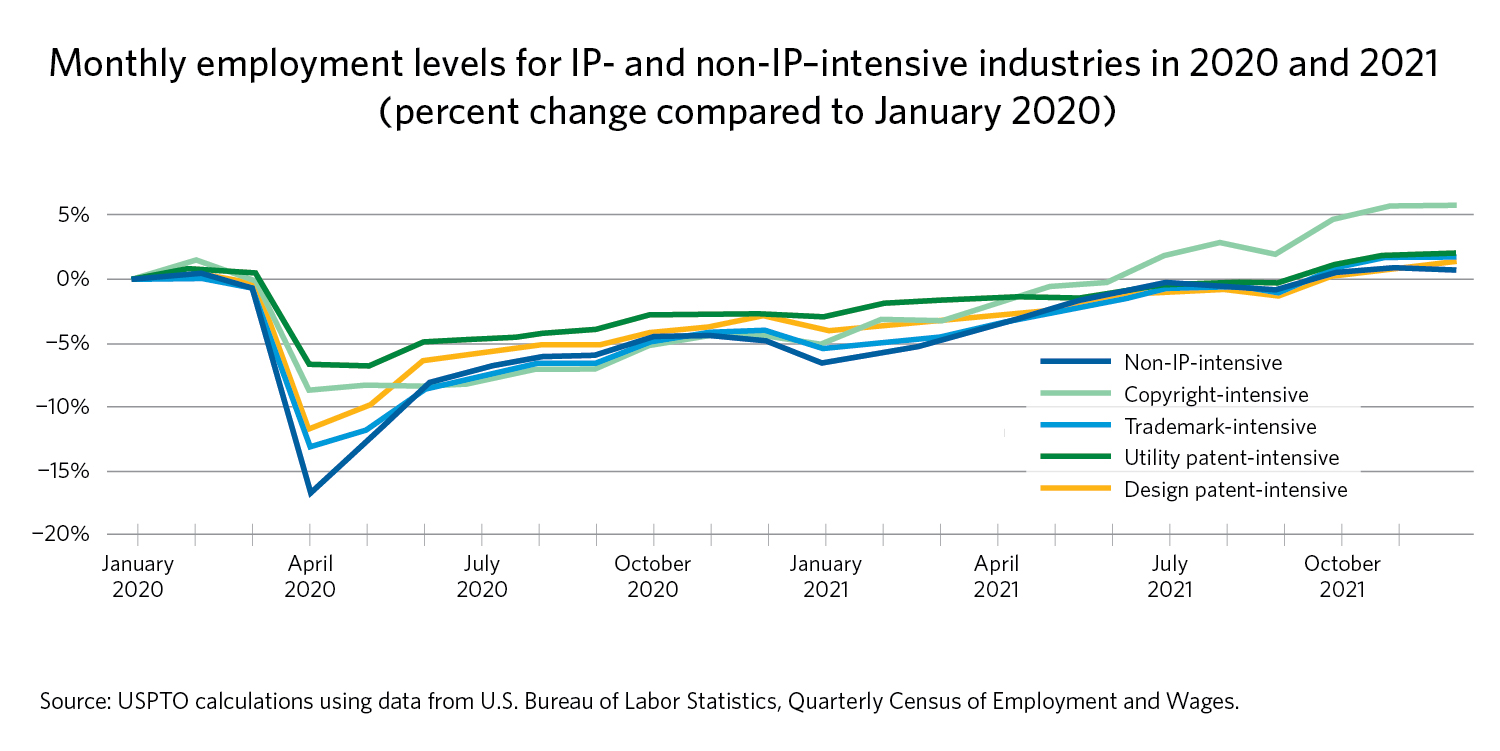
Employment in IP-intensive industries during the COVID-19 pandemic and beyond
In this Economic Note we examine the impact of the COVID-19 pandemic on employment, with a special focus on those industries that most intensively use various forms of intellectual property (IP). In an analysis of monthly employment data, we find that initial job losses (as a share of total employment) were lower in the IP-intensive industries than in other, non-IP-intensive industries. Recovery across all industry groups was rapid after the initial job losses, except for the performing and creative arts industries, which did not see significant improvement until the spring and summer of 2021.
IP Data Highlights
Where are U.S. women patentees? Assessing three decades of growth
The United States Patent and Trademark Office released “Where are U.S. women patentees? Assessing three decades of growth.” The report uses county-level data to highlight where women inventors are patenting, and to identify local economic factors that are correlated with women’s participation. One finding reveals that women’s participation is increasing geographically. Between 1990-2019, 411 new U.S. counties have women patentees, a 32% increase.
Artificial Intelligence (AI) is diffusing broadly across inventor-patentees and companies
Artificial Intelligence (AI) is diffusing broadly across inventor-patentees and companies
Technology diffusion is the spread and adoption of a new technology by inventors, companies, and other innovators. Technologies that diffuse broadly have potentially large effects on innovation, productivity, and economic growth. For example, steam power, electricity, and information technology greatly enhanced the volume, as well as the variety, of goods produced within the economy.
A new U.S. Patent and Trademark Office (USPTO) report, titled “Inventing AI: Tracing the emergence of AI with U.S. patents,” finds that AI is diffusing broadly across technologies, inventor-patentees, companies, and U.S. geography. The figure below shows that the percentage of U.S. organizations (green line) and inventors (dashed blue line) that patent in AI increased from under 5% in 1980, to just over 20% in 2018. This is remarkable growth and shows that AI is increasingly important to U.S. invention.
The USPTO report develops an AI algorithm to find AI in U.S. patents. That is, a machine learning AI algorithm is used to determine the volume, nature, and evolution of AI and its component technologies as contained in U.S. patents from 1976 through 2018. This approach improves the accuracy of identifying AI patents by better capturing the diffusion of AI across technology, companies, inventor-patentees, and geography.
More information on the diffusion of AI, as well as the AI method used to identify AI patents is available in the OCE report, “Inventing AI: Tracing the diffusion of AI in U.S. patents.”
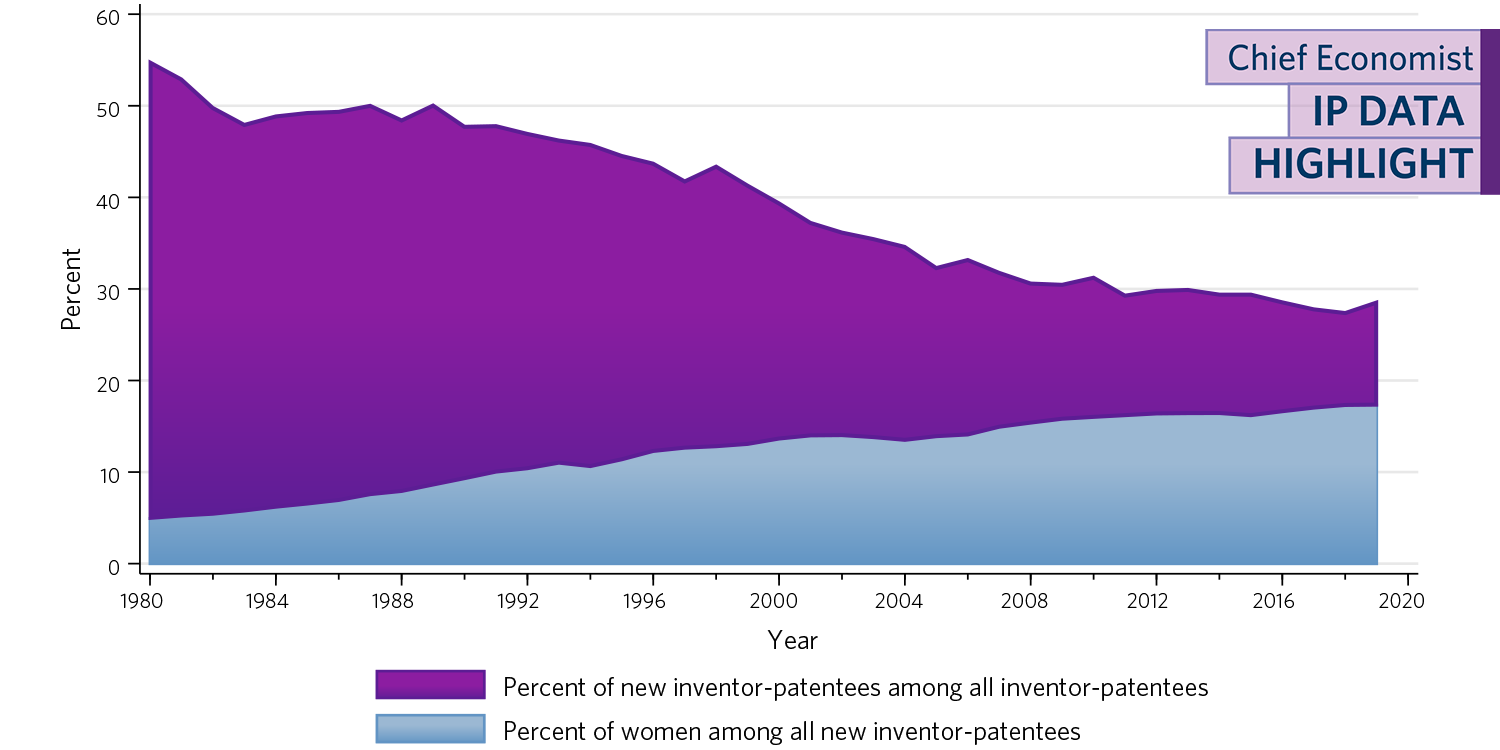
Progress and Potential: 2020 update on U.S. women inventor-patentee
This report updates the USPTO’s 2019 report on U.S. women inventor-patentees, “Progress and Potential,” using three years of new data, covering 2017 through 2019. It provides new information on women’s participation in the U.S. patent system, finding, among other things, that women make up an increasing share of all new entrants to the patent system, rising from about 5% of new inventor-patentees in 1980 to 17.3% by 2019 (see figure).
Progress and Potential: A profile of women inventors on U.S. patents
The USPTO released "Progress and Potential: A profile of women inventors on U.S. patents," a report on the trends and characteristics of U.S. women inventors named on U.S. patents granted from 1976 through 2016. The report shows that women still comprise a small minority of patent inventors. Further, it highlights the untapped potential of women to spur U.S. innovation.

Recent USPTO examiner guidance decreased uncertainty in patent examination
On June 19, 2014, the U.S. patent system experienced a major change. The U.S. Supreme Court reached a unanimous decision in Alice Corp v. CLS Bank International (Alice) that altered the law on patent subject matter eligibility (the types of inventions that are legally eligible for patent protection). Although legal changes and subsequent adjustments across the institutions in the patent system are not unusual, Alice deserves particular attention because of its potential economic consequences.
A new USPTO report shows that in addition to increasing the percentage of first office action Section 101 rejections, Alice significantly increased uncertainty in the patent examination process. Economic theory and evidence show that greater uncertainty tends to reduce investments. Higher levels of uncertainty may also negatively affect previously issued patents by lowering their expected value, reducing patent purchases and licensing transactions, and limiting opportunities to obtain entrepreneurial financing.
In addition, the report shows that recent USPTO guidance for examiners (the 2018 Berkheimer memorandum and the 2019 Revised Patent Subject Matter Eligibility Guidance (2019 PEG)) largely reversed the impacts of Alice, reducing both the percentage of first office action Section 101 rejections and examination uncertainty. The figure above plots uncertainty in the first action stage of patent prosecution related to determinations of subject matter eligibility, before and after the 2018 Berkheimer memorandum and 2019 PEG. For Alice-affected technologies, the figure shows that the variability in first office action Section 101 rejection rates started to decrease after the issuance of the Berkheimer memorandum (dashed red vertical line). Although not as steep, a similar drop is apparent in the control group of other technologies. The memorandum, therefore, appears to have had no statistically distinct effect on examination uncertainty in Alice-affected technologies as compared to other technologies.
The 2019 PEG, however, had a much larger, statistically significant effect on examination uncertainty, particularly in Alice-affected technologies. As seen by the sharp downward kink in the dark blue line after the 2019 PEG (solid red vertical line), examination uncertainty significantly decreased in Alice-affected technologies (relative to the “Other technologies” control group).
Additional information on the impacts of Alice and subsequent USPTO guidance is available in the OCE report, "Adjusting to Alice: USPTO patent examination outcomes after Alice Corp. v. CLS Bank International."
Working papers
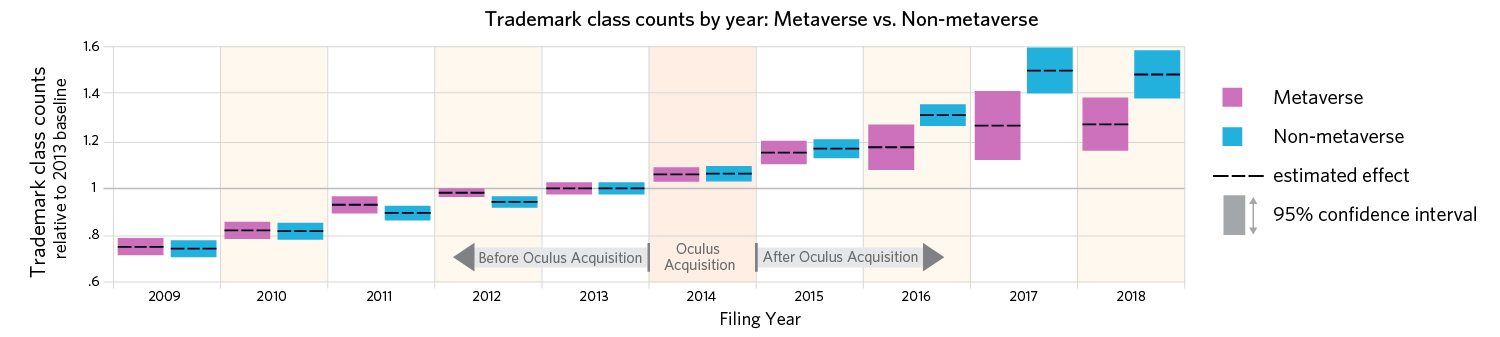
Competitive Dynamism in Nascent Markets – Trademarks and Superstar Firm Entry in the Metaverse
OCE released a working paper titled, “Competitive Dynamism in Nascent Markets: Trademarks and Superstar Firm Entry in the Metaverse.” This paper studies the firms filing for trademarks related to the early metaverse, and documents the impact of Facebook’s 2014 acquisition of Oculus on other firms’ metaverse activities. The analysis finds that Facebook’s entry led to a 10% decline in new metaverse trademarks; decomposing this average effect, larger firms were minimally impacted, while smaller firms and those involved in the import or export of physical goods experienced the largest declines. For more information, read the working paper.
Impact of 2001 piracy shock on R&D spending and IP filings by at-risk software firms
The figure below presents the impact of the 2001 launch of BitTorrent, a major expansion of online piracy, on innovative activity in the software industry. Compared to the control group, software firms at risk of piracy increased their R&D spending and filings of copyrights, trademarks, and patents by 50% or more following the 2001 piracy shock. This suggests that greater rates of innovation may be an effective response to digital piracy. Read more about this study in the USPTO Working Paper on Software Piracy and IP Management Practices.
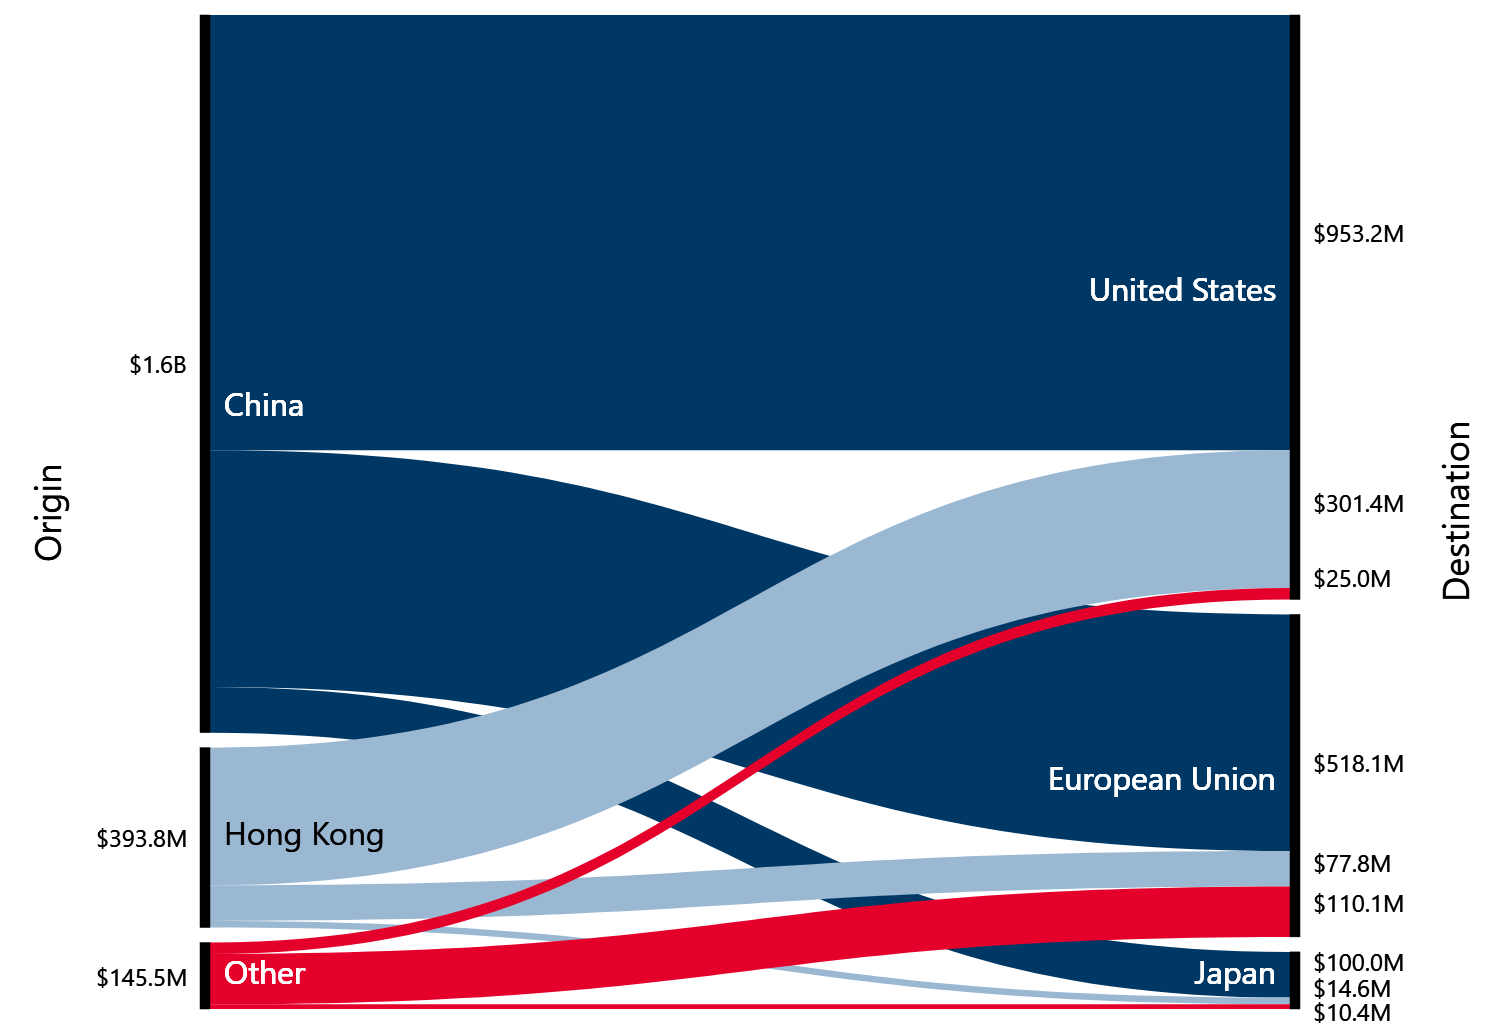
Top three producers/importers of counterfeit
The figure below exhibits the world’s top three producers and importers of counterfeit goods over the 2010 to 2014 period. In that period, China produced nearly $1.6 billion in counterfeit products that flowed largely to the United States, but also to the European Union and Japan. Hong Kong and other countries accounted for substantially lower levels of counterfeits than China. Read more about this figure in the landscape of counterfeit trade report.
Exploiting the Invention Similarity of Patent Citations to more Accurately Measure Vertically Overlapping Claims
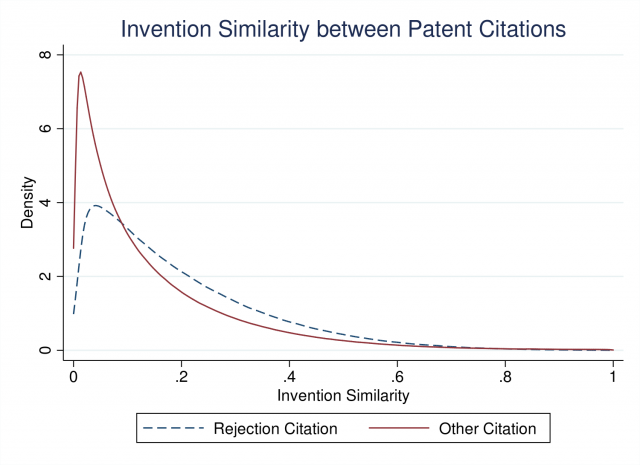
Recent research shows that patent citations suffer from significant noise, measurement error, and weakening informational content (Gambardella, Harhoff and Verspagen 2008; Roach and Cohen 2013; and Kuhn, Younge and Marco 2017), casting doubt on the accuracy of citation-based measurements of technology flows, patent value, complexity and the various economic mechanisms in patent thickets (Egan and Teece 2015). The recently released USPTO Office Action dataset (Lu, Myers and Beliveau 2017) allows for further assessment of the informational content of patent citations.
The figure above displays the textual similarity between the claims from a focal patent and the claims contained in the focal patent’s citations (what we call invention similarity). The dashed blue line represents patent claim similarity using only those citations contained in a USPTO examiner’s Office Action while the red solid line represents patent claim similarity to all other citations to the focal patent. From the figure, the solid red curve lies above the dashed blue curve at low levels of claim similarity. This tells us that many of the citations not used in Office Action rejections are not technologically similar based on claim language. While citations contained in examiner Office Actions generally have higher technological similarity, some of the non-office action citations still contain valuable information. For instance, those that have a similarity index of 0.2 and higher.
OCE Economists and Data Scientist used the textual similarity of patent claims in citations to improve existing citation-based measures of vertically overlapping claims. Please see the working paper for further details along with the full references cited here.
Research datasets
Discovering value: Women’s participation in university and commercial AI invention
OCE published an article titled, "Discovering value: Women’s participation in university and commercial AI invention," in the journal Nature Biotechnology.
Using the AI patent dataset and information on the gender of inventors in PatentsView, the article finds that women’s participation in patenting—both in AI and other technologies—is growing and associated with more diverse teams and patents with higher economic value.
The figure below shows the difference in patent value for inventor teams containing an equal number of men and women relative to those with all men. Using patent values in 1982 dollars from Kogan et al. (2017), across all technologies, patents from gender balanced teams were $1.04M more valuable ($3.28M in 2023 dollars, adjusted using a consumer price index). The difference was substantially larger in biotechnology, at $3.48M ($10.99M in 2023 dollars), and even higher in biotechnology AI, at $11.53M ($36.42M in 2023 dollars).
The figure includes all patents issued in 1976-2020. For more information, read the article.
PatentsView: Patents in the midwest region
The Midwest has historically been an industrial powerhouse of the United States. From the map above, the top patent-producing assignees in the Midwest are located near Detroit, Chicago, and the Twin Cities of Minneapolis-St. Paul. Despite this concentration, there is strong patenting activity throughout all the states in the region.
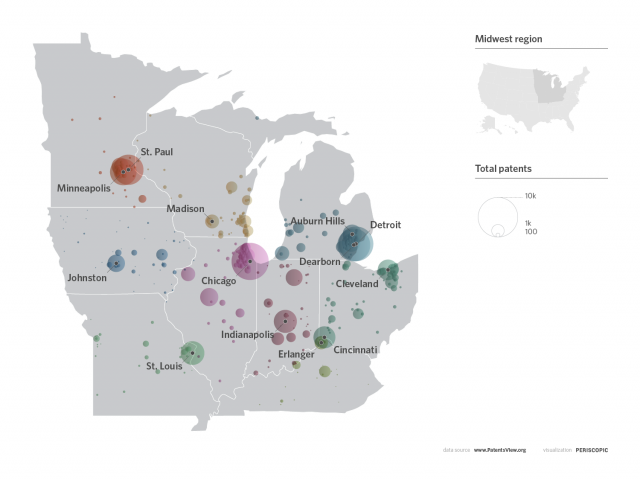
Patent production in these states was relatively constant between 2013 and 2017, with the notable exception of Michigan, which saw a sharp rise after 2014. Michigan is also consistently the region’s top patent producer, followed by Illinois, Minnesota, and Ohio. Visit the PatentsView site to find additional graphics on the Midwest Region.
The USPTO's Midwest Regional Office is located in Detroit, Michigan. This regional office gives inventors, entrepreneurs, and small businesses the added benefit of USPTO presence and enables the USPTO to work closely with intellectual property services, start-ups and job-growth accelerators in this region. Additionally, the Midwest Regional Office collaborates with local science, technology, engineering, and mathematics (STEM) organizations.
Data for this post was provided using the PatentsView website and database.
The Drastic Rise in Patent Litigation (2000-2015)
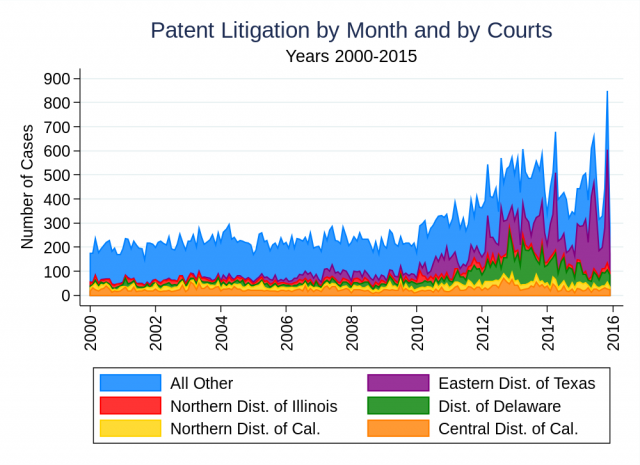
Since 2009, patent case filings in U.S. district courts have been rising at an alarming rate. Interestingly, there are also significant monthly fluctuations in case filings, particularly in some district courts.
The figure above shows monthly rate of new case filings since 2000. Notably, there appears to be a clear break in the trend starting around 2011, after which monthly filings increased substantially and also became more volatile. Both of these changes might be attributed to procedural changes affecting filing practices. These trends and fluctuations could adversely impact the costs and functioning of U.S. district courts.
Another issue is the location where patent litigation suits are filed. Policy makers and courts have struggled for over a quarter of a century with the “proper venue” for patent litigation. One case, TC Heartland, is currently before the Supreme Court along with a number of amicus curiae, many of which discuss behaviors such as “forum shopping” and “forum selling.”[1]
The figure highlights the trends in filing across five major district courts: Eastern District of Texas, District of Delaware, Northern District of Illinois, Northern District of California, and Central District of California. It is notable that the Eastern District Court of Texas had over half of all of the monthly filings more than once in the past two years. The District of Delaware also had a significant share of the filings, although we observed a slight decline in its share in the last two years. One possible explanation for these changes may be that plaintiffs are increasingly targeting select district courts for their filings. It remains an open question whether forum shopping behavior explains these changes.
Figure was developed using the Patent Litigation Dataset which contains detailed patent litigation data sourced from PACER and covers the period 1963-2015. For more on these data, see the related working paper.
[1] While the former refers to plaintiffs selectively filing their case in a court that they perceive as being more patent-owner friendly, the latter refers to a court’s application of both procedural and substantive laws in a manner favorable to a plaintiff.
Trademarks are Increasingly Used as Collateral
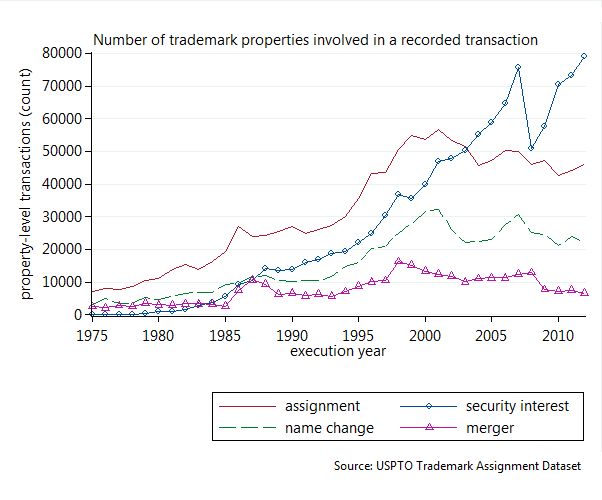
Similar to physical assets like cars, real estate and machinery, trademarks may serve as collateral for a loan. A bank or creditor can record their “security interest” in one or more trademarks with the US Patent and Trademark Office (USPTO), which is analogous to the lien a creditor puts on a car when making an auto loan. The USPTO Trademark Assignment Dataset, which captures such recorded security interests, indicates that trademark owners are increasingly using these assets as collateral. Creditors recorded a security interest in roughly 5,700 trademarks in 1985. By 2007, creditors reported a security interest for over 75,000 trademarks, a 13-fold increase in two decades. While the number of trademarks used as collateral collapsed in 2008, likely reflecting the financial crisis, it quickly recovered to 79,000 trademarks by 2012. In fact, for each year since 2003, more trademarks were involved in a recorded security interest agreement than a recorded assignment (or sale) between parties.
It is important to note that these trends reflect only those transactions recorded with the USPTO, which is not required by law. [1] Overall, more research on trademark collateralization is warranted, and the USPTO Office of Chief Economist released the USPTO Trademark Assignment Dataset and related working papers [2] to that end.
[1] Federal recordation is permissive, not mandatory, though statutory and regulatory law provides compelling incentives for parties to record transactions throughout the entire life of a registered mark.
[2] Graham, S., Marco, A. and Myers, A. (2014). “Monetizing Marks: Insights from the USPTO Trademark Assignment Dataset.” SSRN working paper. Crass, D., Czarnitzki, D. and Toole, A. (2016).
“The Dynamic Relationship between Investments in Brand Equity and Firm Profitability: Evidence using Trademark Registrations.” USPTO Economic Working Paper No. 2016-1